Umami Gimme Some!
An infographic by Jason, Cameron, and Seth
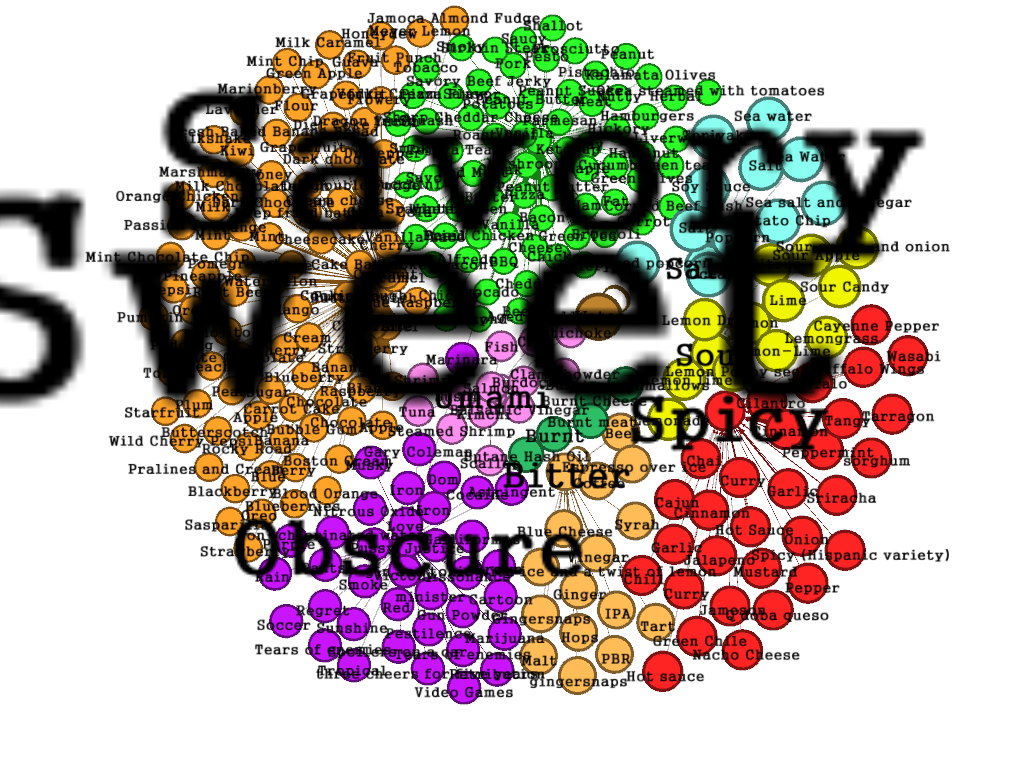
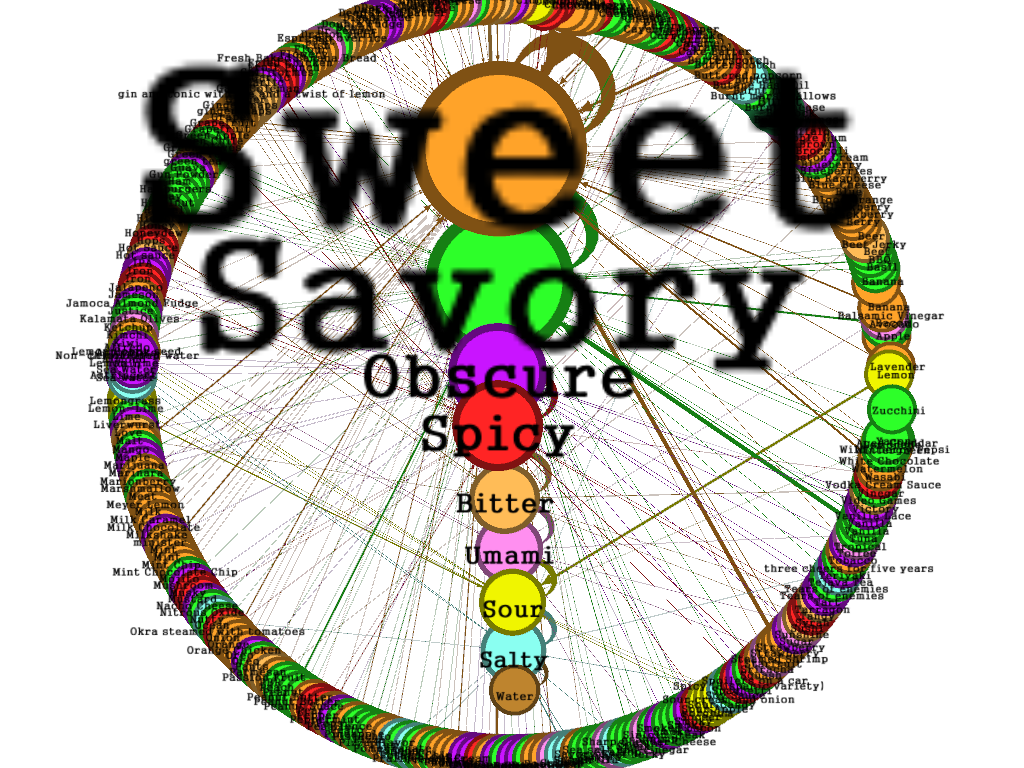
Below you will find identical sets of data manipulated in circular fashion.
Flavor Spiral

We assigned flavors to flavor categories, and then tested the modularity of the network. Upon analysis, several trends were discovered. Our graphs represent the indegree of each node, which is visualized in the form of differing font and node sizes. Nodes with larger indegree are bigger - which effectively demonstrates their importance within the flavor dataset.
Flavor Pie
While the data in this graph may not completely represent the intended flavors people had in mind when they submitted their responses to the simple flavor database - It has given us 10 distinct categories of flavor that are absolutely essential for human life. Those flavors are: Sweet, Savory, Obscure, Spicy, Sour, Salty, Bitter, Umami, Burnt, and last but certainly not least (although the data says otherwise), Water.
Circular Flavors

Water only had one submission, and we think this is appalling. It is certainly a distinct flavor and essential for human life. Another notable conclusion is that things that aren't flavors fell into the third most popular category, Obscure. With entries such as: Gary Coleman, Tears of enemies, Love, and Pestilence - it is clear that some entries to the dataset were made in jest. Still - we were able to divide all of the data into 9 meaningful categories that show us how people interact with flavors. The number one submission - Chocolate, deserves special mention.