If we assume that NCAA football is a social network,
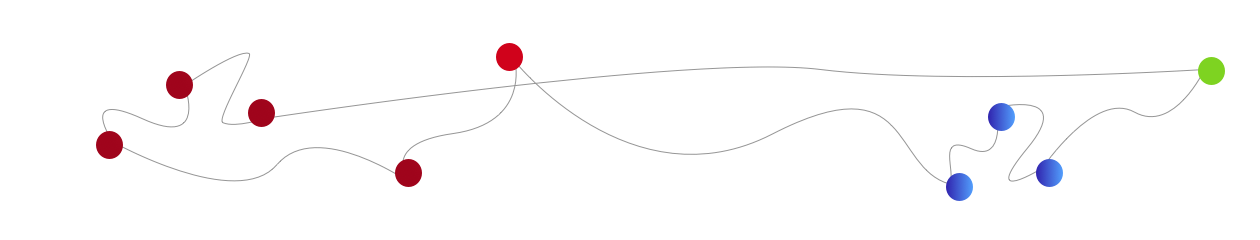
September 6, 2016. The first network has no leader or detectable conferences, just a sea of nodes. I have chosen to render these as a circular graph.
We can infer nothing of consequence from this network except that football games were played.
September 3, 2016: This is the page for my annual effort to render NCAA division 1-A football results as a social network. This is the fifth year of my effort in this area. I have become both more and less ambitious in this regard. This year, I am not interested in scores. The BCS had this right, score data is so noisy and random compared to the clarity of the binary network of the W and the L. This matters in other areas of calculation as well. Elections are step functions, there is generally a binary outcome (in the United States at least). National polls really don’t tell you very much, what matters are the individual states, and within them they might be effectively polled.
Since Hawai’i has already played twice, a week one graphic is possible, although it will say nearly nothing. Worse, week one is riddled with teams that only appear once or twice in the dataset. The SEC is smart about this: holding serve late in the season is useful, let early bad losses fade, and late difficult games in other conferences appear significant. The graphic to be posted will be truly meaningless.
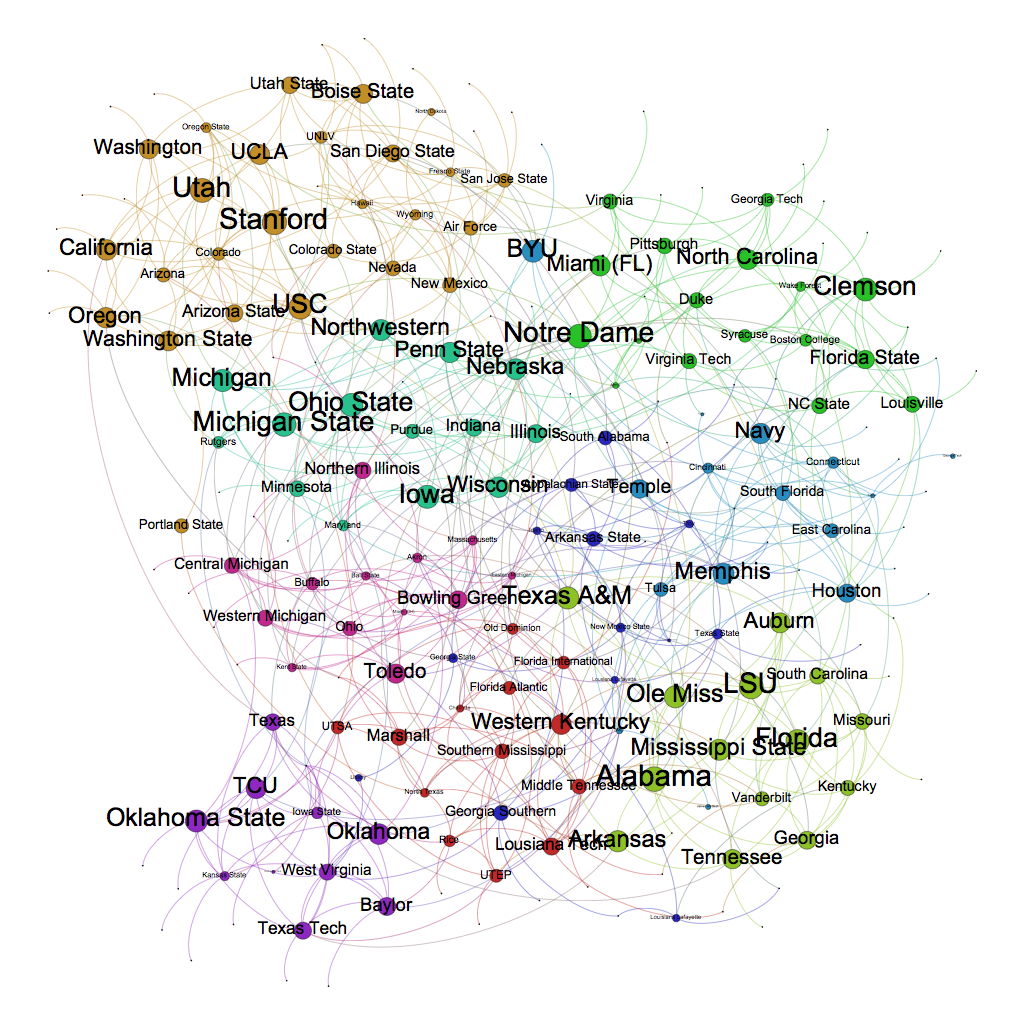
…this is the graph through week twelve:
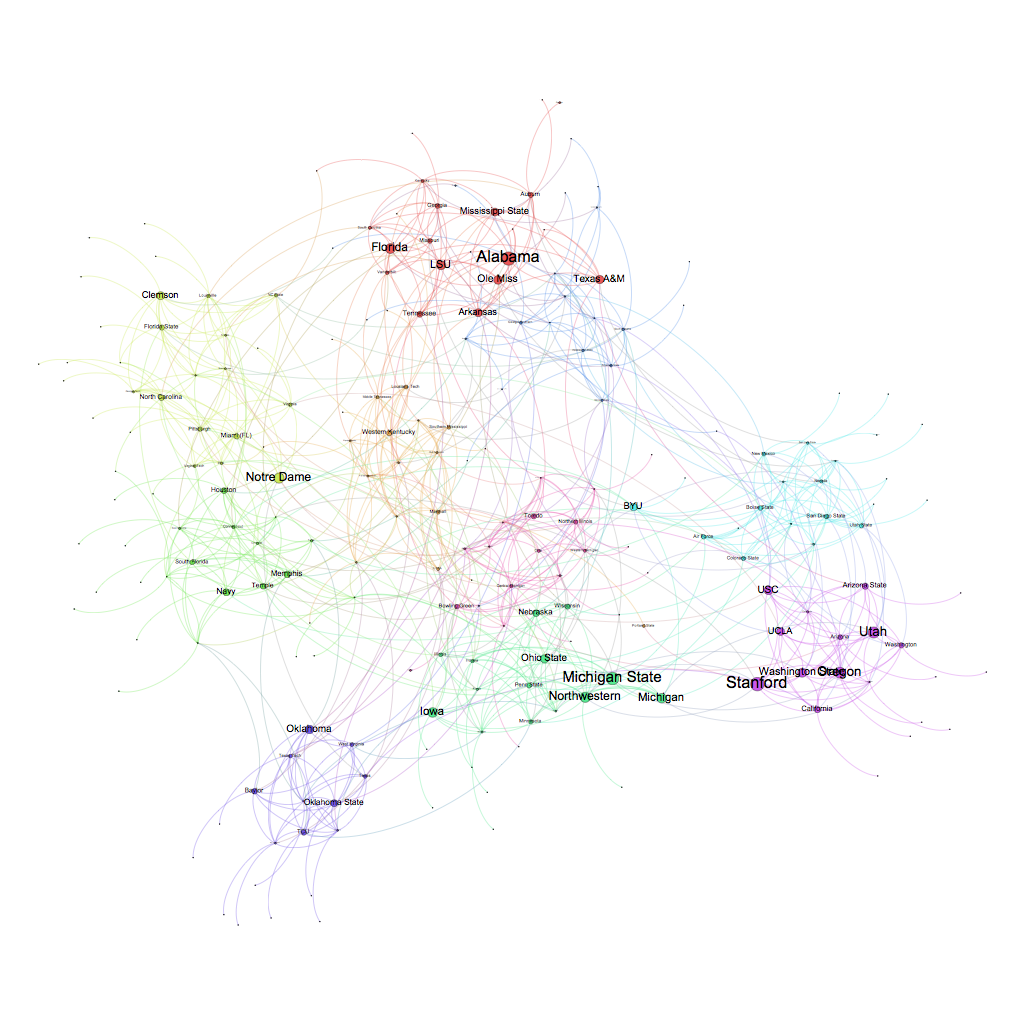
The only major issue this week is the relationship between the ACC and the rest. Clearly, Notre Dame (especially after the Stanford game) will have an elite centrality ranking. It is unclear why Oklahoma would “jump” the order of teams to enter the playoffs. It seems like the committee is giving a sort of conference champ bonus. This begs the question of the playoffs. If the championship had been critical, there should have been an eight team playoff with the big10, big12, pac12, ACC, SEC, and BigEast/American, and two wild-cards. A four team playoff is designed to force the committee to disregard the conferences, or at least to maul one of them each year. Note that Big12 games really don’t say that much, this is is after all the conference of Baylor, the team that doesn’t play anyone. Oklahoma plays a better schedule, so there is less risk of rewarding a bad schedule here, although punishing the Big 12 for Baylor is not a bad idea.
Using Eigenvectors and conferences, the playoff is Stanford, Utah, Alabama, Michigan State. Correcting using records with centralities: Clemson, Iowa, Alabama, Notre Dame. Of course, an MSU win over Iowa would put them in the top four.
The network is quite clear. 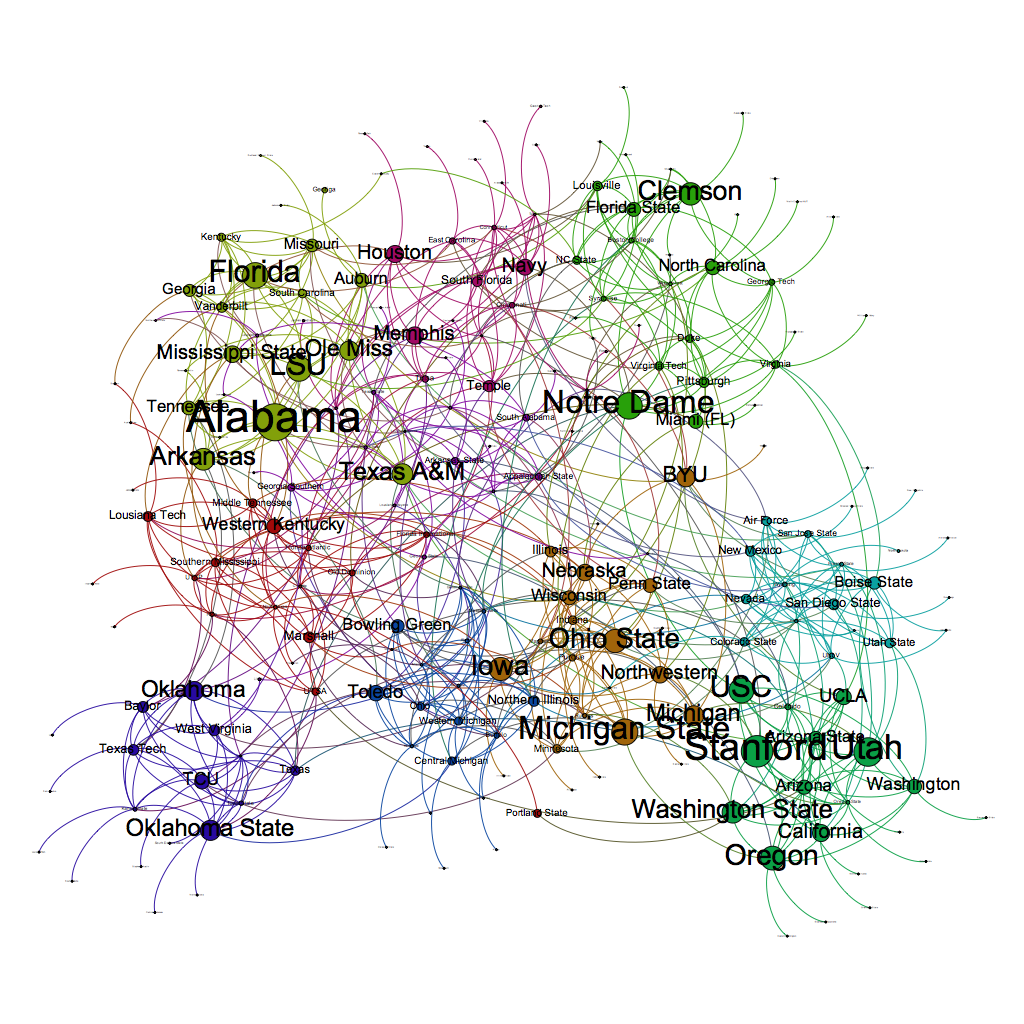
It is unfortunate that Stanford and Utah lost. The strength of schedules of Pac-12 teams are excellent, but with the losses, they are likely eliminated. Ok-St is very much alive as is OU, TCU and Baylor were entirely dependent on going undefeated to make the playoffs.
From here on, I will be using a degree-eigenvector method. Projections:
Ohio State, Iowa, Clemson, Ok-State, Houston, Alabama, Stanford, Notre Dame, Michigan State, Florida, Oklahoma, TCU, North Carolina, Utah, Oregon, Michigan, Memphis, Navy, Toledo, Western Kentucky, Wisconsin, Florida State, Bowling Green Temple, Baylor.
When correcting for future schedule the playoffs are:
Winner OSU-Iowa, Winner Clemson-UNC, Winner OkState-OU, and Winner Alabama-Florida.
Each of the teams in the top 4 area has a major game remaining. The Pac12 is on the outside looking in, a 3 loss team will not be crashing the top four. Not going to happen, especially with a one loss Notre Dame and an undefeated team in the American. If Ok-State loses, I could see Houston sneaking in.
Compared to last year, the conferences are very clearly distinguished.
Eigenvector Rankings:
- Alabama, 2. Stanford, 3. Utah, 4. LSU, 5. Notre Dame, 6. Michigan State, 7. Florida, 8. Iowa, 9. Ohio State, 10. USC, 11. Clemson, 12. Texas A&M, 13. Michigan, 14. Ok State, 15. Ole Miss, 16. BYU, 17. Arkansas, 18. Northwestern, 19. Mississippi State, 20. Memphis, 21. Nebraska, 22. Oklahoma, 23. Cal, 24. Wisconsin, 25. Oregon.
Problems with this model, losses aren’t losses, they actually increase the authority of nodes in some cases.
It seems likely that the winner of Stanford-ND gets a playoff spot.
Clemson, Big10, SEC, ND. With Pac12 and Big12 on the outside is likely.
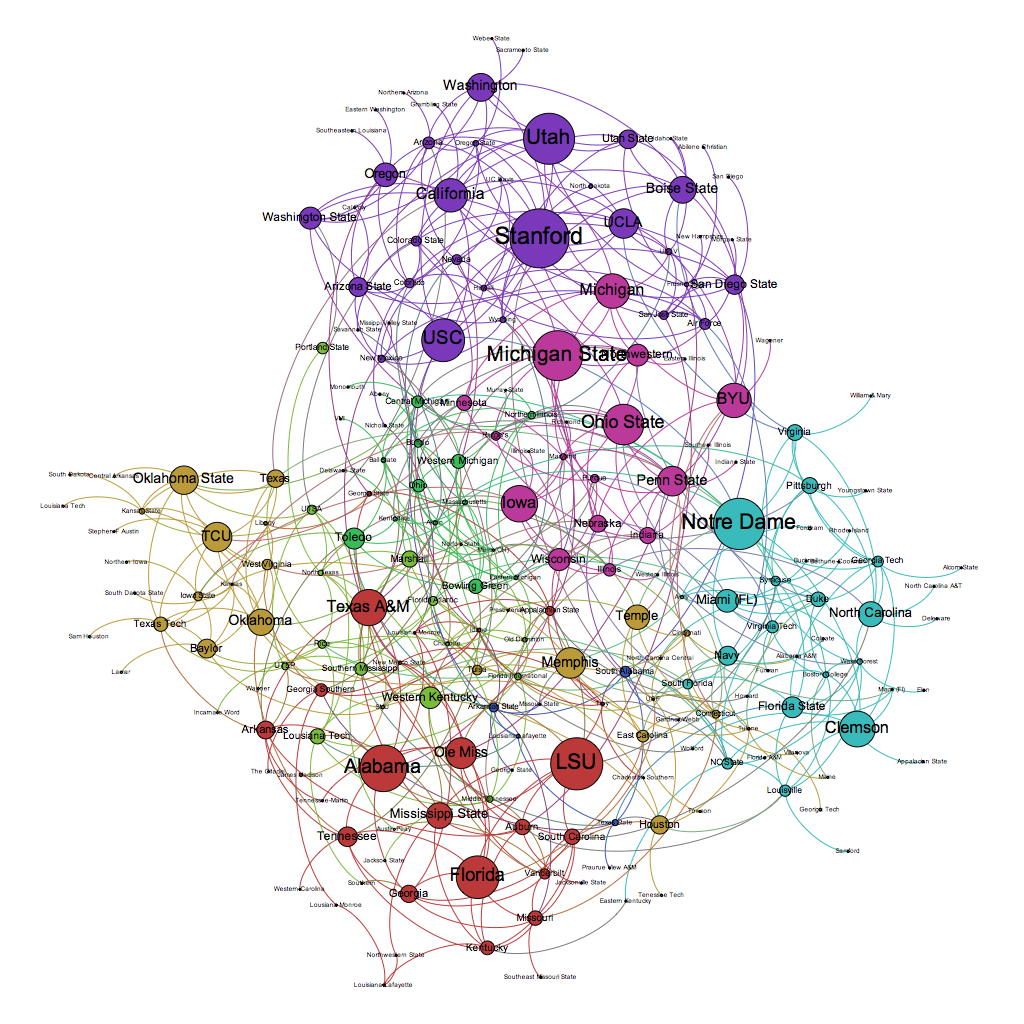
Things to notice: the Pac-12, Big 10 , SEC, and ACC/Notre Dame networks are clearly defined. The American and the Big 12 seem to be tied together at this point, notice that the key nodes for Big 12 are smaller than some multi-loss teams in other leagues. Weak strength of schedule translates into low eigenvector centrality.
Leaders by Eigenvector centrality:
- Stanford, 2. LSU, 3. Notre Dame, 4. Utah, 5. Michigan State, 6. Alabama, 7. USC, 8. Florida, 9. Ohio State, 10. Iowa, 11. Texas A&M, 12. Clemson, 13. Michigan, 14. BYU, 15. California, 16. Ole miss, 17. Memphis, 18. Penn State, 19. UCLA, 20, TCU, 21. Oklahoma State, 22. Washington, 23. Boise State, 24. Oklahoma, 25. Mississippi State.
Keys from the rankings: the American>Big 12. As the networks become increasingly well defined, it will become more difficult for the Big 12 to break into the playoff race.
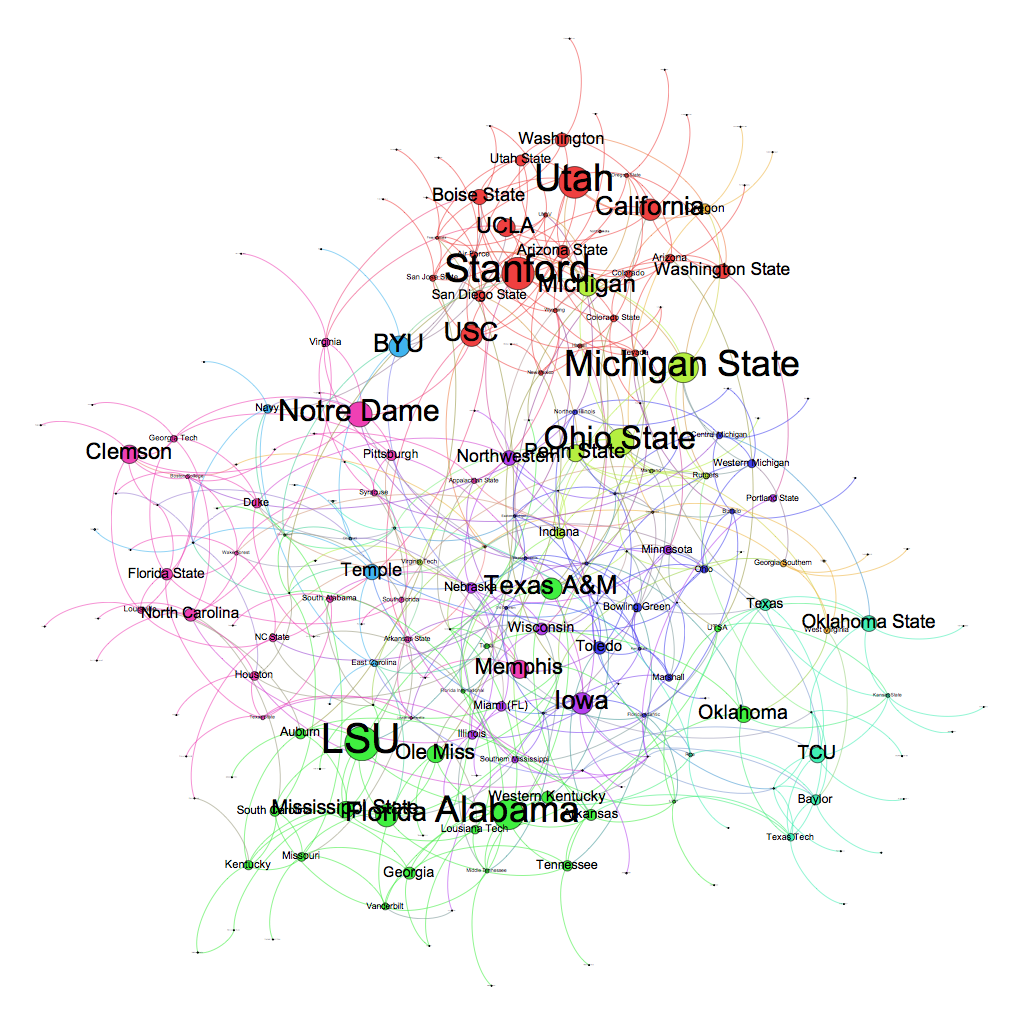
The network is becoming clear, these two weeks of real conference football have made the leaders appear. At first, the Utah loss appears to knock the Pac-12 out of the playoffs. Upon further reflection, this is not the case. The Big-12 schedules are so soft that they may not appear in the playoff at all. Baylor is undefeated but has almost no meaningful role in the network. Stanford-ND may be more important than any game in the entire Big-12. Once Iowa, MSU, and Ohio State are integrated in a single network the Big-10 will be secure. It seems unlikely that any team in the SEC-East will have the strength to make the playoff without winning the SEC. Projected playoff: 1-OSU vs. 4-Stanford, 2-Clemson vs. 3-LSU.
Eigenvector ranking:
- LSU, 2. Stanford, 3. Utah, 4. Alabama, 5. Michigan State, 6. Ohio State, 7. Notre Dame, 8. Florida, 9. USC, 10. Iowa, 11. Texas A&M, 12. Cal, 13. BYU, 14. Michigan, 15. Clemson, 16. Memphis, 17. UCLA, 18. Ole Miss, 19. Penn State, 20. Mississippi State, 21. Oklahoma, 22. Oklahoma State, 23. TCU, 24. Temple, 25. Boise State.
The American may be stronger than the Big-12 based on Eigenvector Centrality. Baylor has an eigenvector of .268 well behind Nebraska, Pittsburgh, and Utah State. Frankly, Baylor could finish undefeated any appear outside the eigenvector top 10, likely somewhere near 15 given the marginal strength of OU and OkSt.
Re-running week five with different metadata.
Top 25
Florida, Stanford, Utah, Texas A&M, Michigan, BYU, Ohio State, LSU, TCU, Northwestern, Ole Miss, Alabama, Oklahoma, Kentucky, Oklahoma State, Michigan State, Minnesota, Clemson, Houston, Iowa, Temple, Indiana, Georgia, North Carolina.
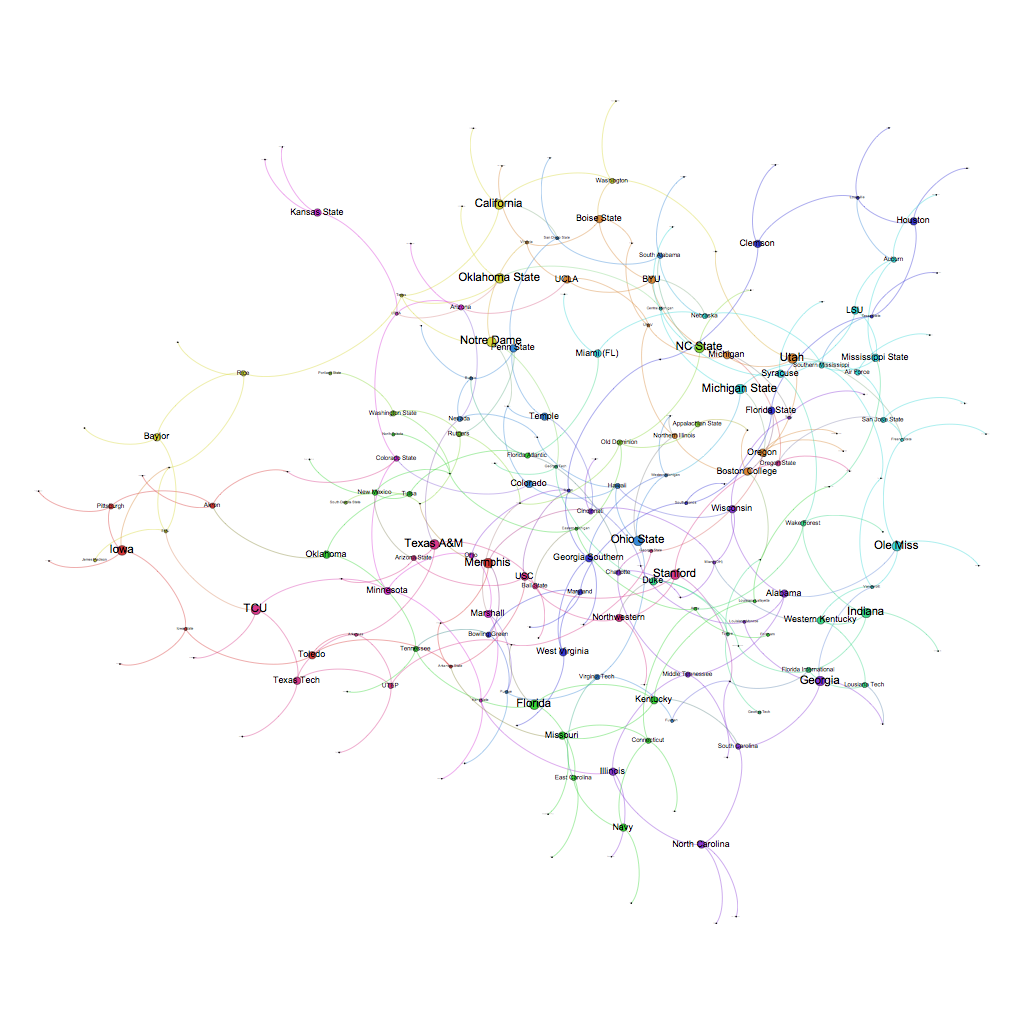
Shape:
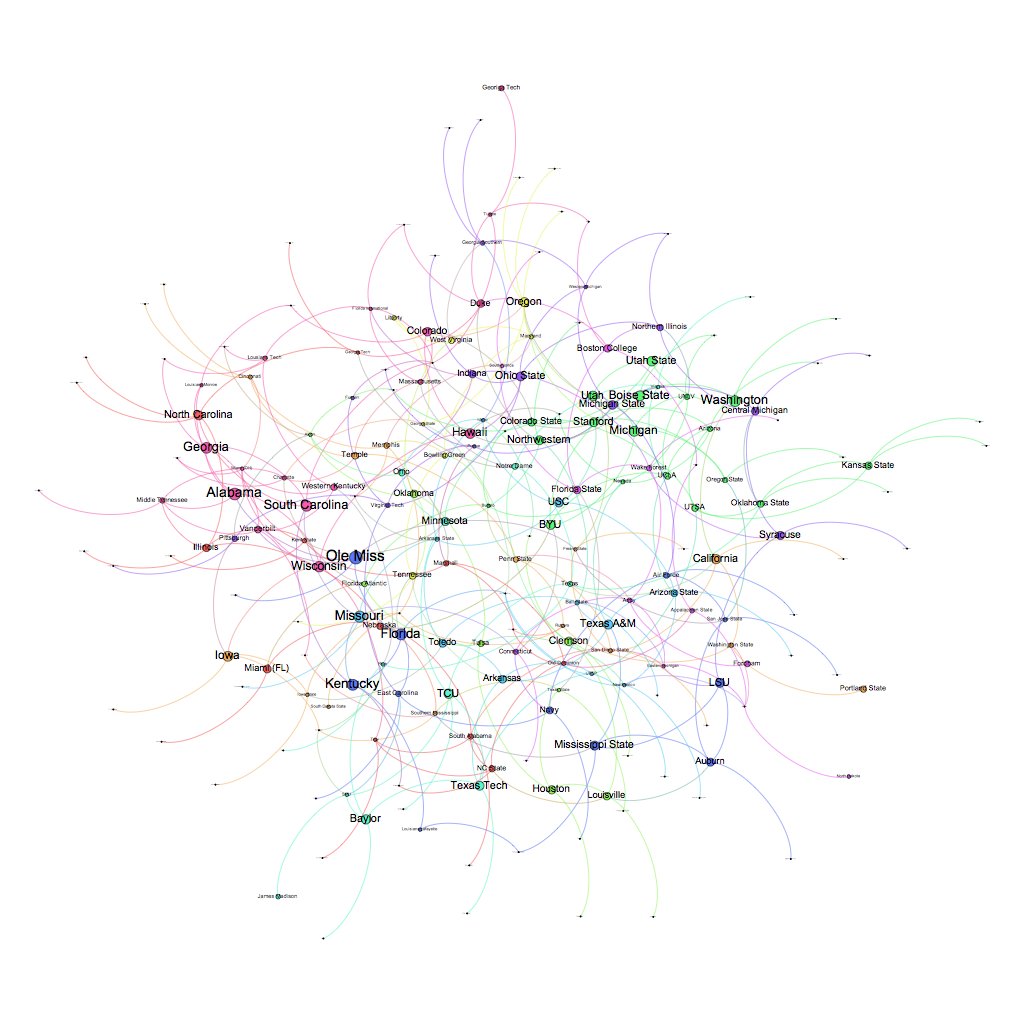
You can see that the shape of the network has changed, it is now closer to a pentagon. Given the importance of the power five conferences, it seems likely that as each sub-network congeals through the conference schedule that the points will become clearer. Compared with recent years the impact of inter-conference play seems muted, which will make the debate of Big 12 vs. ACC for the fourth slot more intense as the season reaches an end. I start from the perspective that SEC, Big 10 and Pac 12 get slots in the playoffs inevitably, and there is a very real risk that a one-loss Notre Dame could spoil the playoff, especially since their only loss to this point has been to the likely ACC champion. Utah could be a key bridge node in the longer run. I see no scenario where Big 10 or SEC champion is excluded from the playoff. Then again, we are only a third of the way through network formation. Luckily, the schedule tightens (and the mathematical impact of games increases) as we wind toward the conclusion.
Closeness top 25:
- Ole Miss, 2. Alabama, 3. Missouri, 4. Florida, 5. Kentucky, 6. Georgia, 7. Washington, 8. South Carolina, 9. Wisconsin, 10. Boise State, 11. Michigan, 12. Iowa, 13. Hawaii, 14. Utah, 15. Utah State, 16. Baylor, 17. TCU, 18. California, 19. Texas A&M, 20. BYU, 21. LSU, 22. Oregon, 23. Mississippi State, 24. Northwestern, 25. Stanford.
27. Ohio State, 29. Michigan State, 30. Clemson, 35. USC.
Betweenness and Eigenvector are not yet viable for this network.
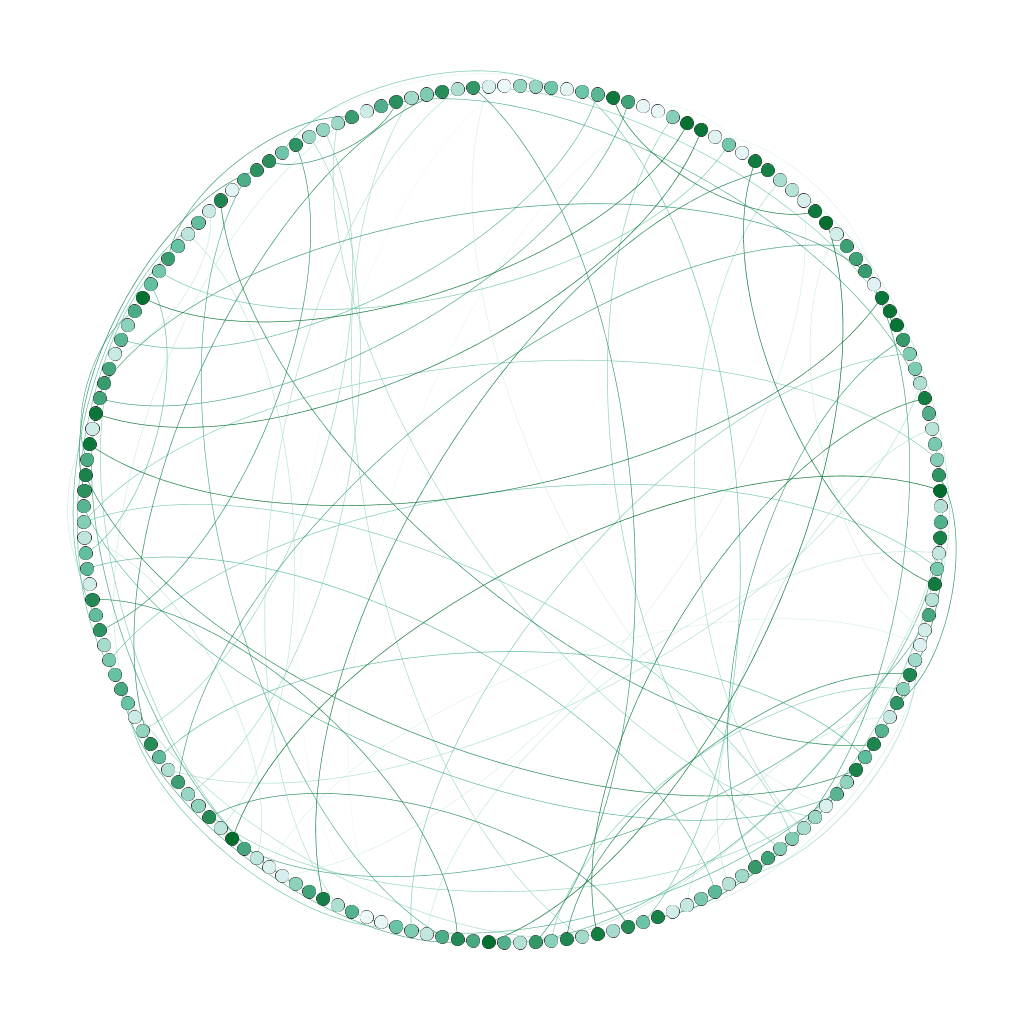
…this is the social graph through week four.
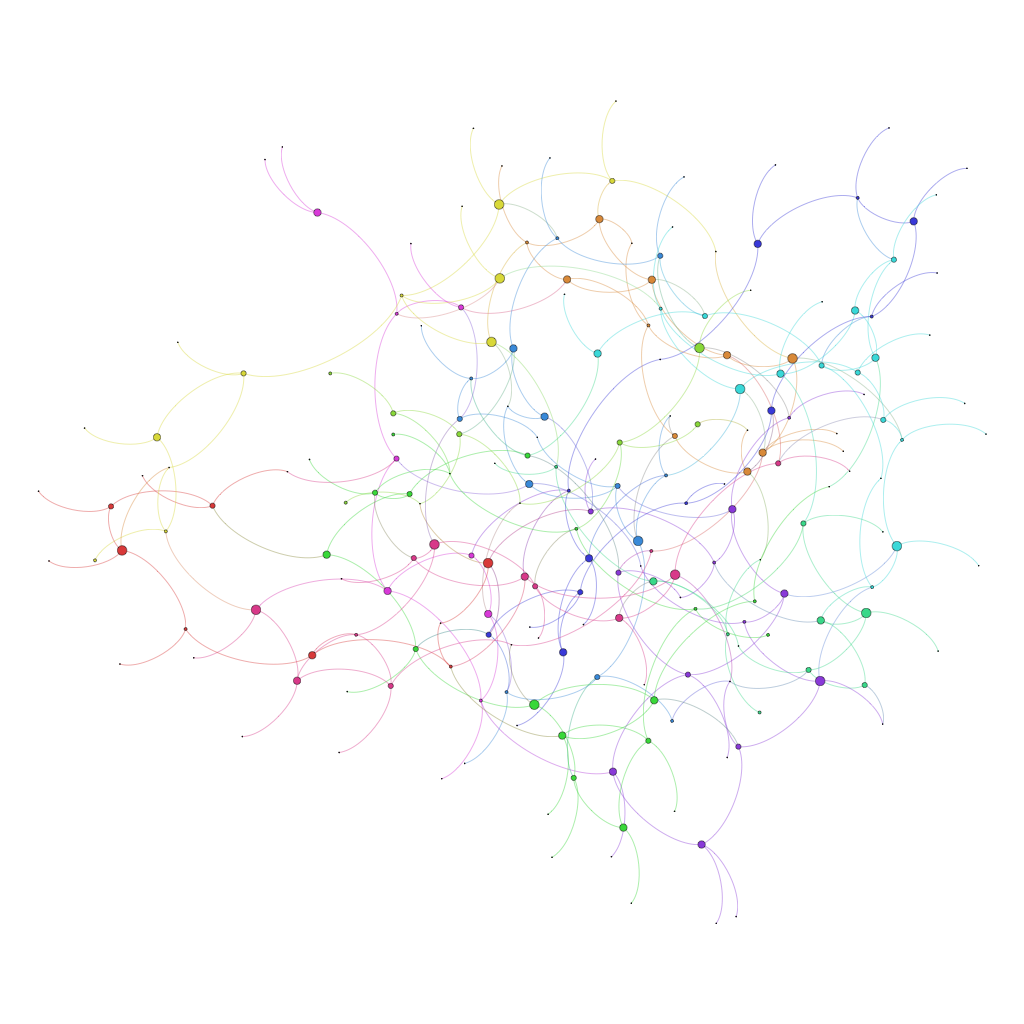
Top 25 as computed by Closeness centrality.
At this point, Eigenvector and Betweeness are not really viable.
- Ole Miss
- Alabama
- Utah
- Florida
- Wisconsin
- Hawaii
- Kentucky
- Georgia
- Michigan
- Ohio State
- South Carolina
- TCU
- Colorado
- BYU
- Kansas State
- Stanford
- Miami (FL)
- North Carolina
- LSU
- UTSA
- Oklahoma State
- Navy
- Tennessee
- Tulsa
- Portland State
Before you say, “hey, Dan, these are really crazy, I thought you did math stuff sometimes?”
My answer, it is way too early and the network is way too underdeveloped to draw meaningful inferences from the games that have been played. Alabama losing to Ole Miss just doesn’t matter that much in this framework. There are also a lot of scheduling artifacts in this model.