After a surprise fifth place finish, Rand Paul dropped out the Presidential race. My scrapings suggested that Paul had a strong Twitter presence, something that could actually mean something if connected with the result in Iowa. That is a big ‘could.’
Money definitely matters. Paul had little of it, with his campaign running with just over one-million and the super-pac with just over four. This is not a well capitalized operation. Paul never caught the support level of his father, no wild-eyed ground game was behind him.
On the ground in Kentucky, he faces a primary and then a strong democratic challenger from Lexington. Kentucky Republicans delivered on their promise to cut “Obamacare” by ending the state’s extremely popular Kynect program. Combined with growth in Lexington and Louisville and the polarization of the Evangelical vote, it seems that the safe place for a Southern Libertarian may have become quite tight.
Paul had a fairly robust social media impact for a candidate with his fundamentals. It didn’t translate into a win. Trump has an outsized social media impact compared to Cruz, this translated into a near tie for third. Neither polls nor tweets effectively predicted the outcome. All measures are suspect.
Super Tuesday is less than a month away. There is no chance that any of these candidates will be effective in building a ground game in each state. The question is, will Paul voters head for any of the remaining candidates, or will they head toward Sanders as Penn and Teller recommend?
The Iowa Caucuses are tonight. My predictions on the basis of Twitter data from a time-bound (during the townhall) and space-bound (just Iowa) dataset.
Clinton and Sanders are running relatively even. There is a lot of Twitter heat for Sanders, although much of it comes through retweets. Methodologically, this is suspect given the use of Twitter as a transmit medium during media events. Much of the Twitter activity is at least topically about Clinton. The most popular Tweets seem to turn on reclaiming the name ‘socialist.’
The volume of Sanders re-tweets is difficult to process. Thousands of lines of my sample (100,000) are taken by the same tweets. The near lack of meaningful user content is shocking, over these six months of research it seems like twitter is less democratic by the week.
The Republican ticket is more difficult to predict. In this dataset there is something striking – between the mass Sanders and Clinton retweets, there is a Republican: Rand Paul. Not Trump. Paul.
The use of the expression 4Deep in my data refers to the number of layers of interaction I have built into my social network of the hashtag. Because of limitations in my computing power, it is difficult to get the data as clean as I would like. I will be revisiting this dataset (and approach) in July to render the entire election on Twitter.
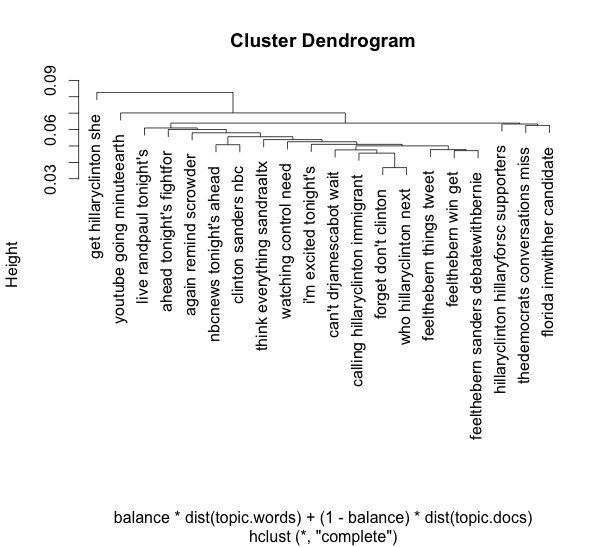
The final democratic debate before the Iowa caucuses was held on Sunday night. Post-debate questions almost always include: who won? Aggregated polling methods have proved to be a good tool for shifting journalism toward more productive questions. Unfortunately, aggregated polling is more difficult in these elections. We can try to get some leverage on the question of “who is winning Twitter,” although if you have followed my research you would know that judging the disposition of Twitter as a whole is a dubious enterprise.
Twitter conversation related to the debate, was underwhelming. The balance of retweets to tweets was two-to-one, which is not surprising given that Twitter tends to become a broadcasting medium during crises, rather than a dialogic medium. So, how do we get a sense of the temperature of Twitter when it is so erratic?
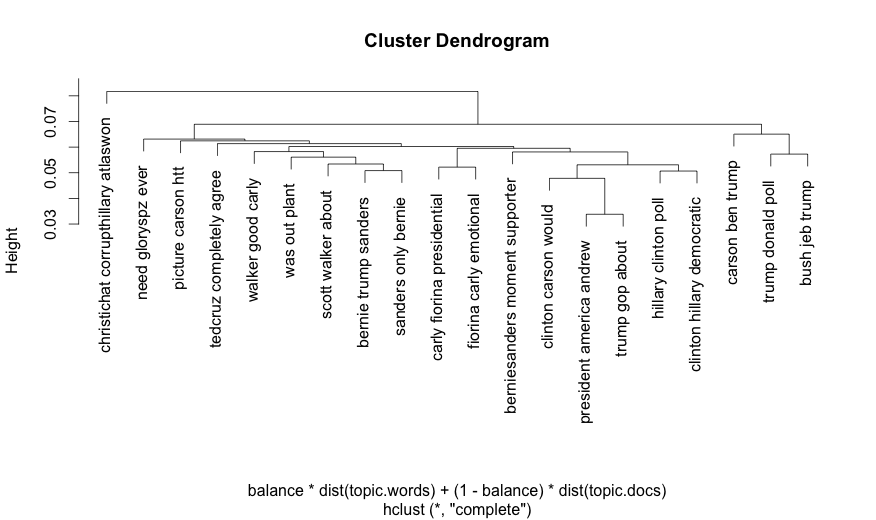
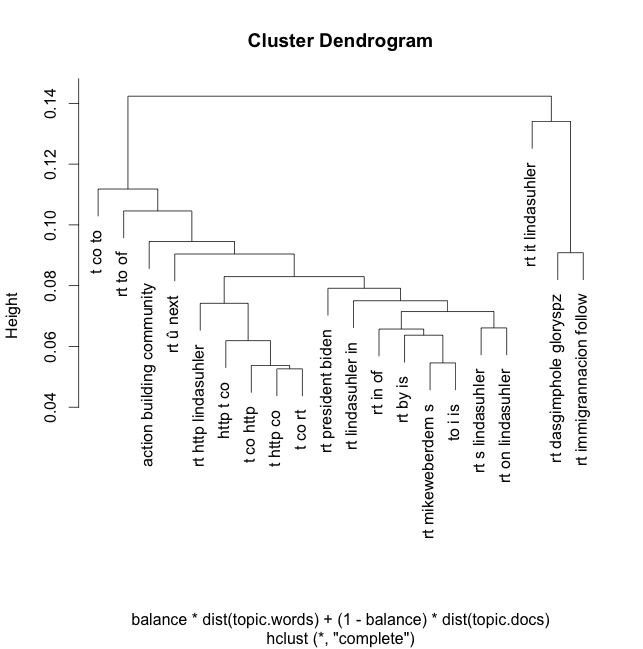
Here is the first dendrogram:
Here is the problem: most of these posts just seem to include the names of candidates. Not policy positions. As a general overview, Sanders was the subject of roughly one-thousand more Tweets than Clinton.
The retweet leader was from Donald Trump, “Notice that illegal immigrants will be given ObamaCare and free college tuition nothing has been mentioned about our VETRANS”
Followed by Sanders: I got into politics not to figure out how to become President. I got into politics because I give a damn.
Then a Sanders quote: “I believe in a society where all people do well, not just a handful of billionaires.” – Bernie
Aside from Huckabee attempting a racist joke, the Trump veterans argument, the top of the debate re-tweet stack was Sanders heavy.
Much of the retweet activity came in repeated calls to follow a live-tweet or sign-up for Clinton’s text message update plan. If we are judging by which selection of retweets named someone the most, a sort of emotional expressive politics, Sanders won. Although, parsing robots and retweets could just as easily mean that a server somewhere won.
Even when using Twitter’s metadata to sort retweets, most of the original content appears to be unoriginal. Many uncoded retweets and other such noise. Even in the ostensibly original content, a third mentions sanders, and roughly a quarter mentions Clinton. Using immigration as a proxy for issue engagement, only 41 of the 11,000 original tweets contain that string. Isis appeared 70 times. It seems that the bulk of material in this original content section are declarations of support for one candidate or the other.
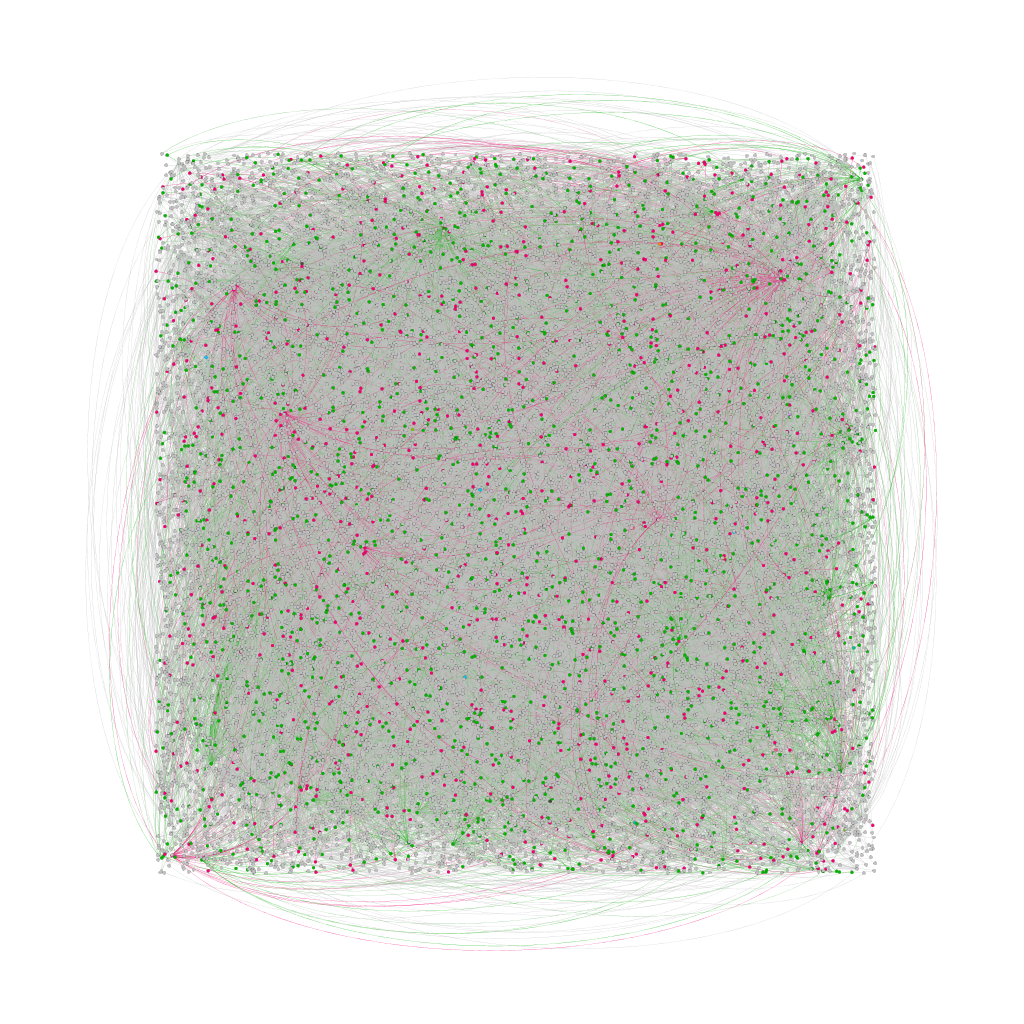
When structured as a network, there are a few clear cores of activity. The most powerful individual nodes are the conservative jjauthor and former Fox personality Steven Crowder. Nearly tied with Crowder was People4Bernie, followed then by a cluster of, Hillary Clinton, The Democrats, SandraALTX, PoliticalMiller, Hillary4Florida, GlennHeiser, YouTube, RandPaul, ZaidJilani, BernieSanders and HillaryClinton originals (rather than retweets) appear in this region as well. After this group there is a rapid fall in centrality of any given node.
The green and red modularities are only roughly an eighth of all computer detected in this network. In short, there are tens of thousands of people talking to each other, with very little meaningful network control. Unless you are a Conservative author, in which case you have something.
People4Bernie clearly was the strongest handle in the network flow, although there were also strong Clinton handles. This high eigenvector score suggests that Sanders could more effectively seed information into the conversation by way of his supporters.
So, who won?
The Sanders organization had great strength in controlling message flow, although Clinton also had a good bit of traction. It is fascinating that from this perspective the most retweeted (Trump) has almost no meaningful centrality to this network. In short, Sanders was running Twitter, but that may not mean much.
Part of my research includes the scraping and visualization of bulk Tweets. I end up seeing a lot of sentences this way, far more than I will ever actually read. I use Mallet to text mine my Twitter collections.
I have noticed a number of groups attempting to create what appear to be wire services either with regional handles or candidate specific Twitter streams, such as the candidate_news_network and POLS. These are messing up my analysis as they pump huge volumes of uniform text with little relevance.
Here is my line on these enterprises: they are a false start at best and generally junk.
This is what Wikipedia calls a junk pile.
Does anyone really care what a brand new wire service writes in a microblog format? I can’t believe that any real fan of a candidate needs a curated Tweet stream when they can have the real thing.
This is Twitters problem in a nutshell: the news services are a poor substitute for a poor substitute for real news and analysis. Are these services intended for “novice” users? Newsflash: there aren’t many of those, Twitter is slowly burning out, not building new. My best guess is that these news services are intended to accumulate followers and then sell out. Sort of like Twitter should have long before that IPO thing.
What does this mean for me? Finding ways to clean this stuff out of my dataset, blerg.
There are slight variations that include some other references such as “@truethevote,” but the general purpose of this category seems to be a claim related to voter fraud. The poster is a part of an active Twitter network that circulates Tea Party related messages. This network is very small and highly active, if I re-modeled to exclude retweets they would likely fall away entirely. There is little doubt that this network is quite artificial. This particular network seems to like Trump and Carson, and strongly dislike Clinton, Rubio, and Bush. They don’t seem to have a lot of activity related to Fiorina or Sanders.
The second topics seem to be a cluster on other candidates with one side twisting toward Walker and Sanders. Fiorina has an entire sub-section, with no reference outside of that sub-section.
The last cluster of the dendrogram includes references to Bush, Trump and Carson.
Clearly there is a strong anti-Clintion sentiment and a strong Tea Party resonance, but the real flow of Tweets seems to be related to the idea of a pure populist rage that occasionally includes references to particular candidates. This is not candidate advocacy.
I may need to find a new approach to cleaning the data…
From what I have monitored on Twitter, Ben Carson may a well not be running for President. In the primary stream of election Tweets his name is nearly non-existent and the Tweets that feature him tend to be poorly formatted. To be very specific, Carson is mentioned in less than .05% of all Twitter traffic related to the main election hashtag.
It would be something of a surprise if he was tied with Trump as, well, he has basically no social media following.
But what does it mean for Carson to pull equal to Trump? The following list should be taken as a probability assessment without evidence.
A. It could confirm my suspicions so far, that Trump’s social media support and that most election activity is autopoetic, or these are hacks and robots arguing with and persuading each other in a self-congratulatory pablum. This can be true in combination with the other explanations.
B. Perhaps people really like Ben Carson, this is not an entirely unlikely scenario, but it seems to over look a great deal of other polling that suggests that Trump is strong. It is also difficult to take Carson as the candidate in this role as he, like Trump, is so deeply attached to the media. In this case, Carson is a favorite of Fox News. This could also explain why he has such a small social network footprint: support for Carson or Trump may break based on media preference. If Trump leads Republicans with smart phones and Carson those with cable, who will win the newspapers, and for that matter the bartenders?
C. The polls could be faulty, especially individual polls this early in the contest.
I am sure we will get more clarity at some point, but as it stands now, this is just more detritus in a murky stream.
#Squadgoals is an index of fandoms often ignored by the popular press, this computational approach mines the use of this hashtag, with all the possibilities and pitfalls inherent in that method.
If you are not familiar with youth culture, this post won’t be particularly meaningful for you, even some folks I know who are tuned in, don’t know about squad goals. Such as…
#squadgoals, see also: cheetah girls
Things you need to know, fan cultures are organized around references to a central identity or fandom with other lesser elements organized around that. In this case, one could be a part of the cheetah girls fandom, and thus identify with the imaginary community of the squad. When the entire operation is well-oiled, you are in fact, on point.
But what are the most important squads today? Clearly the Cheetahs were important a decade ago but their continued squad-ness depends on nostalgia – not a new fandom. My students (Oregon State, Survey of Social Media) really wanted to know more about the squads, especially which ones were dominant on Twitter.
Method
Our method? We scraped Twitter for all uses of the hashtag #squadgoals, this is frankly more interesting than the use of #relationshipgoals or even just #goals. We then used Mallet to do topic analysis of the resulting scraped Tweets.
There was one big problem: Twitter isn’t exactly reliable. There were over five-thousand squadgoals tweets over the past thirty-six hours. When we asked for the last 200,000 it returned that the API could only return just under 36,000 tweets and that those only went back a week. Issues with Twitter are known, if one wants real longitudinal Twitter information they need to observe over time. There is no last second or retroactive research solution.
Also, here is a bigger problem. Any sort of token analysis like this is vulnerable to noise. A robust stopwords file can filter the results for better analysis. The choice of stopwords is fraught with danger, as the stopwords file improves, the topics assigned and the model will appear to fit the data, or at least the researchers sensibility of the data, more and more closely. There is a real risk that a researcher using a frequency table and a stopwords file could sculpt a computer reading of a document sent that fits their needs. Of course, all research can fall prey to the problem of heuristic availability – some researchers go hunting for a significant p value, there are many possible sins to be committed here. For the purposes of this project, I used my main stopwords file, stopwords2.txt, which I can provide if you would like it. As an aside: I do think that the development of stopwords files is an important topic for critical cultural studies, especially as practitioners deploy computer listening, reading, and vision.
Unfortunately, I am not going to be renewing my Tableau license until October, and Mircosoft excel is about as useful as a hammer for polishing a glass menagerie in situations like this, so R driven graphics will be coming your way.
Results
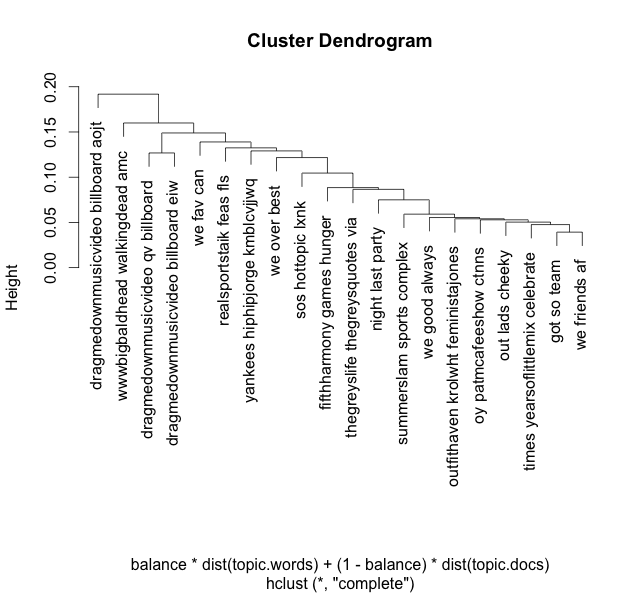
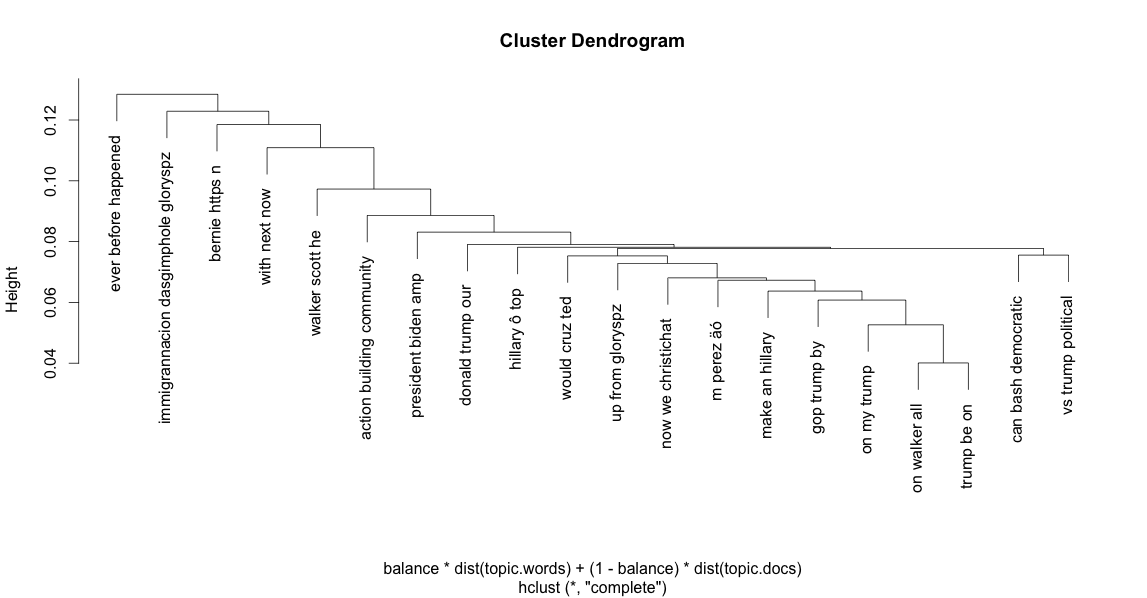
Results expressed as a dendrogram:
As the chart cascades down, smaller topics are broken from the larger topics, or more precisely, the topics that are lowest in the tree are those first collapsed into the larger topic. The dominant squads of the third week of August, 2015.
Squad Ranks
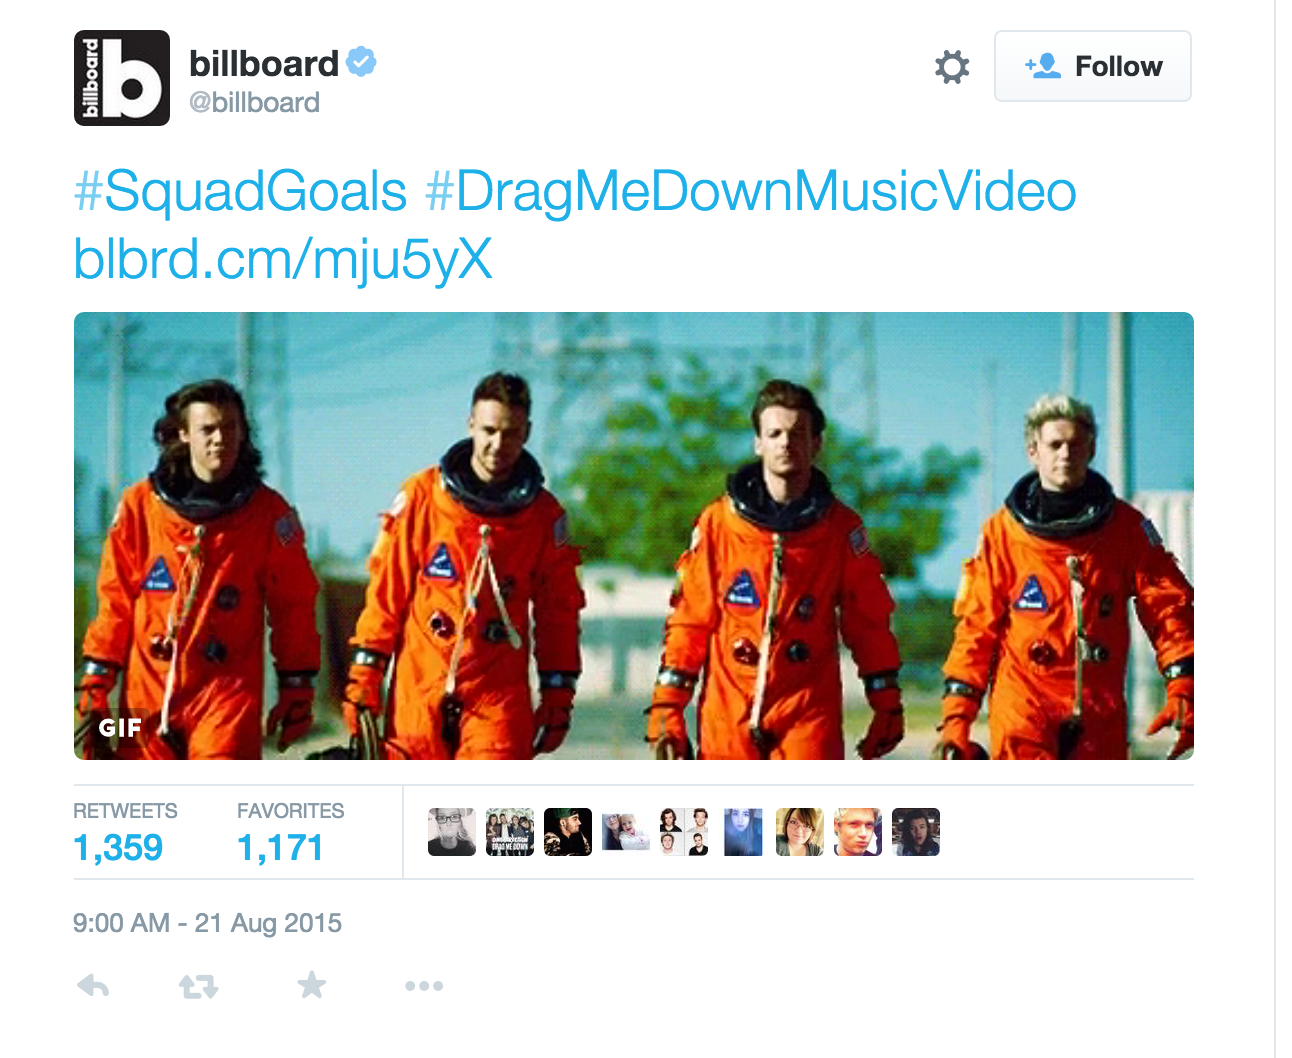
Results as a list with pictures.
1. One Direction (trying to figure out the relationship to Timberlake)
2. Walking Dead
3. Sports/Yankees
4. 5 Seconds of Summer
5. Hottopic
6. Hunger Games.
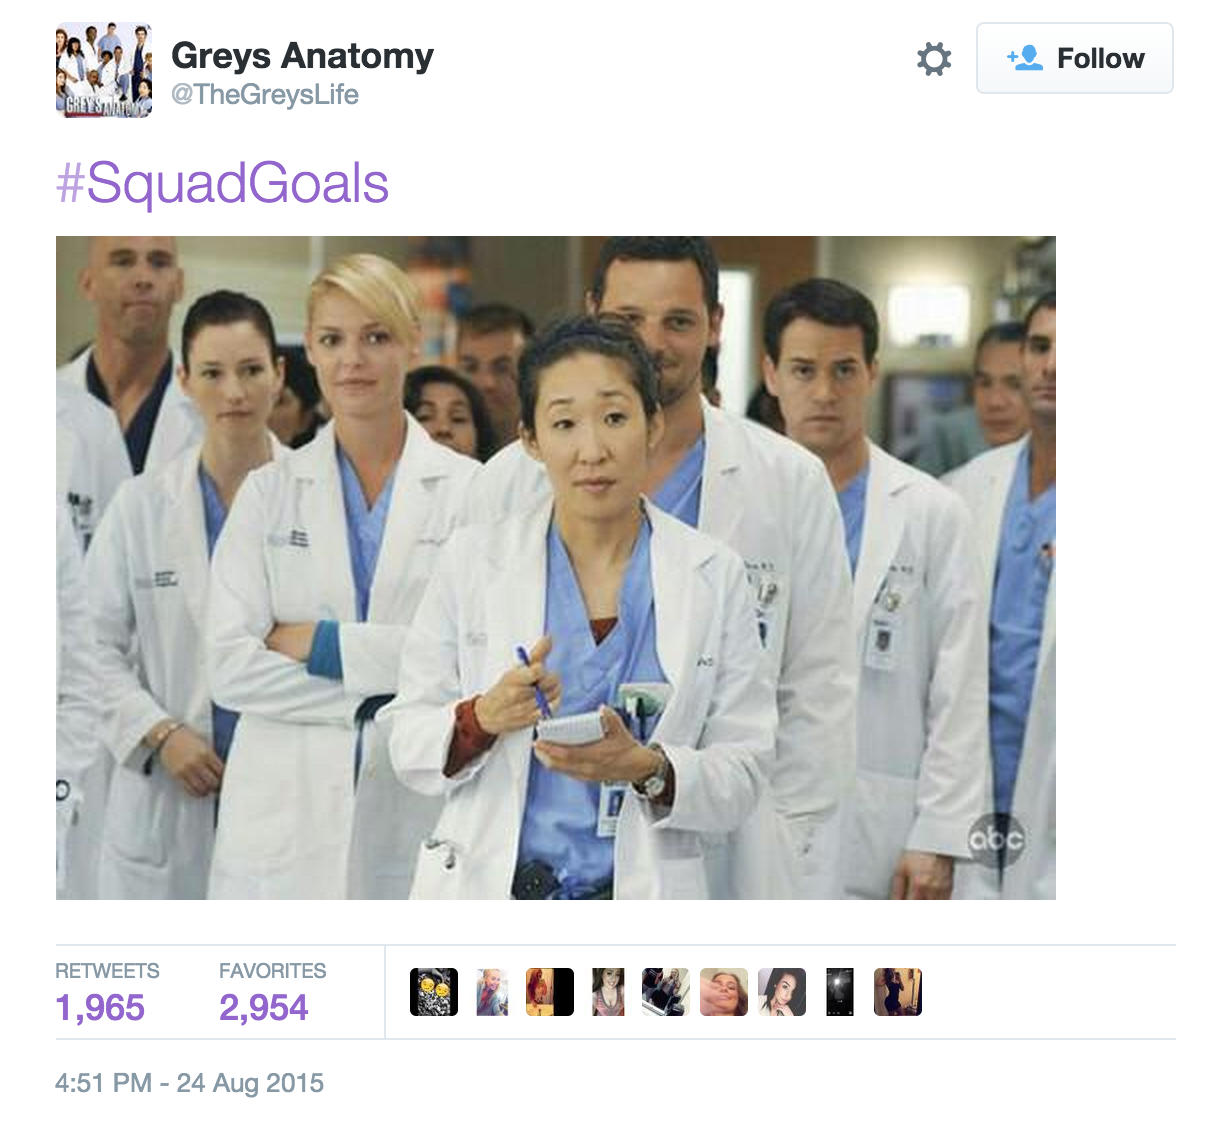
7. Fifth Harmony. (Taylor Swift just officially added Fifth to her squad, btw.)
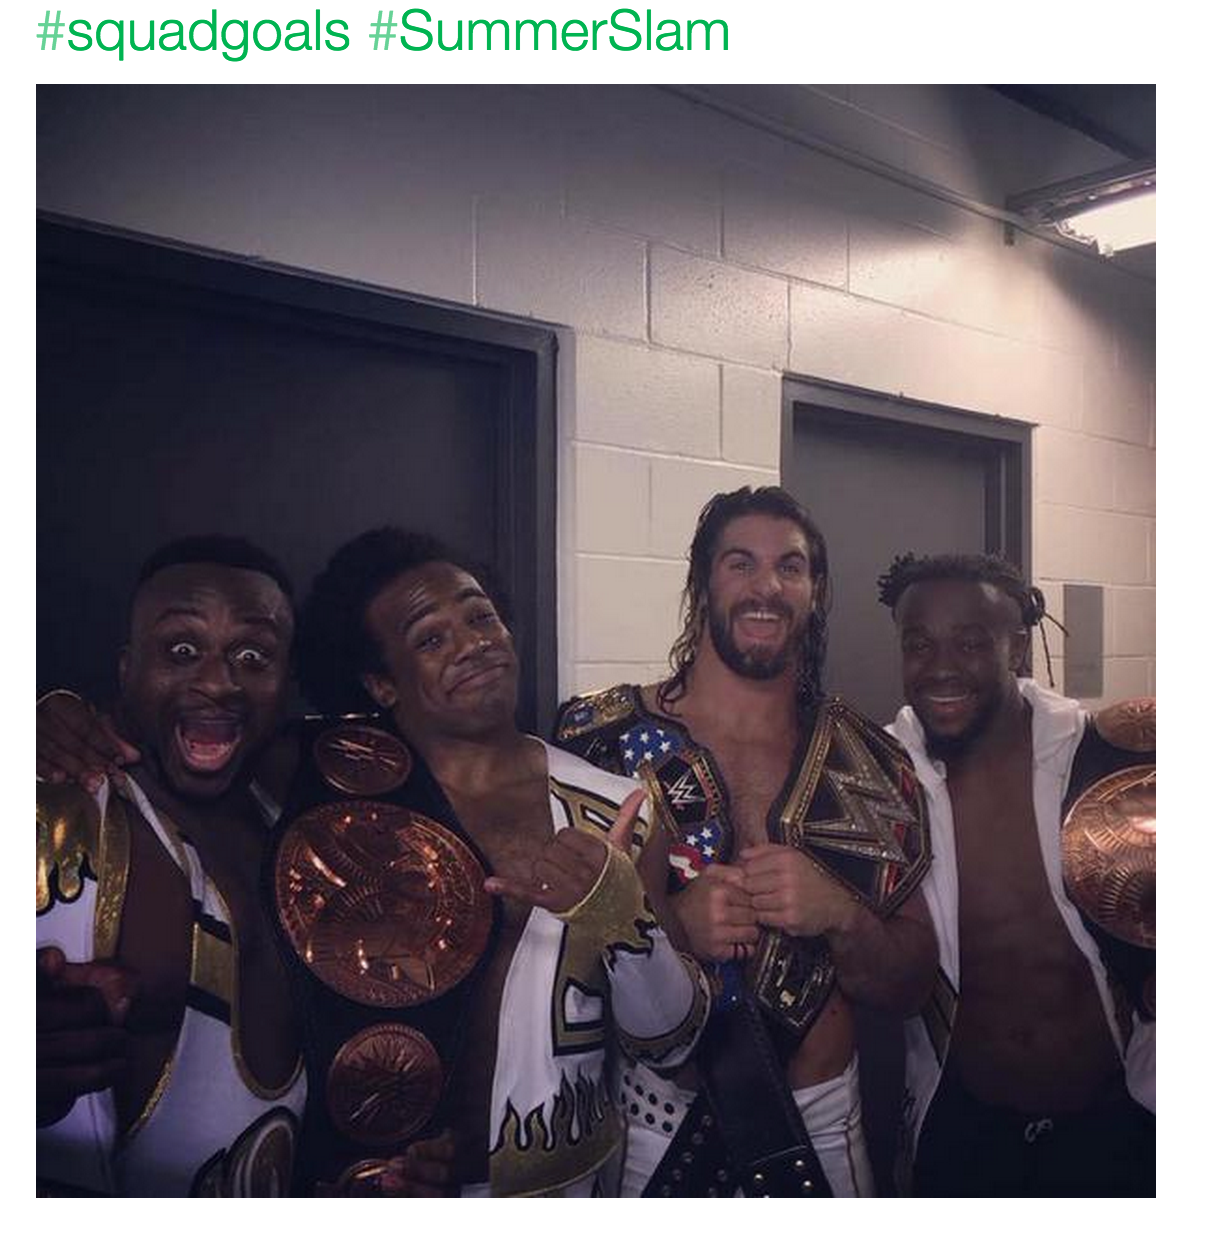
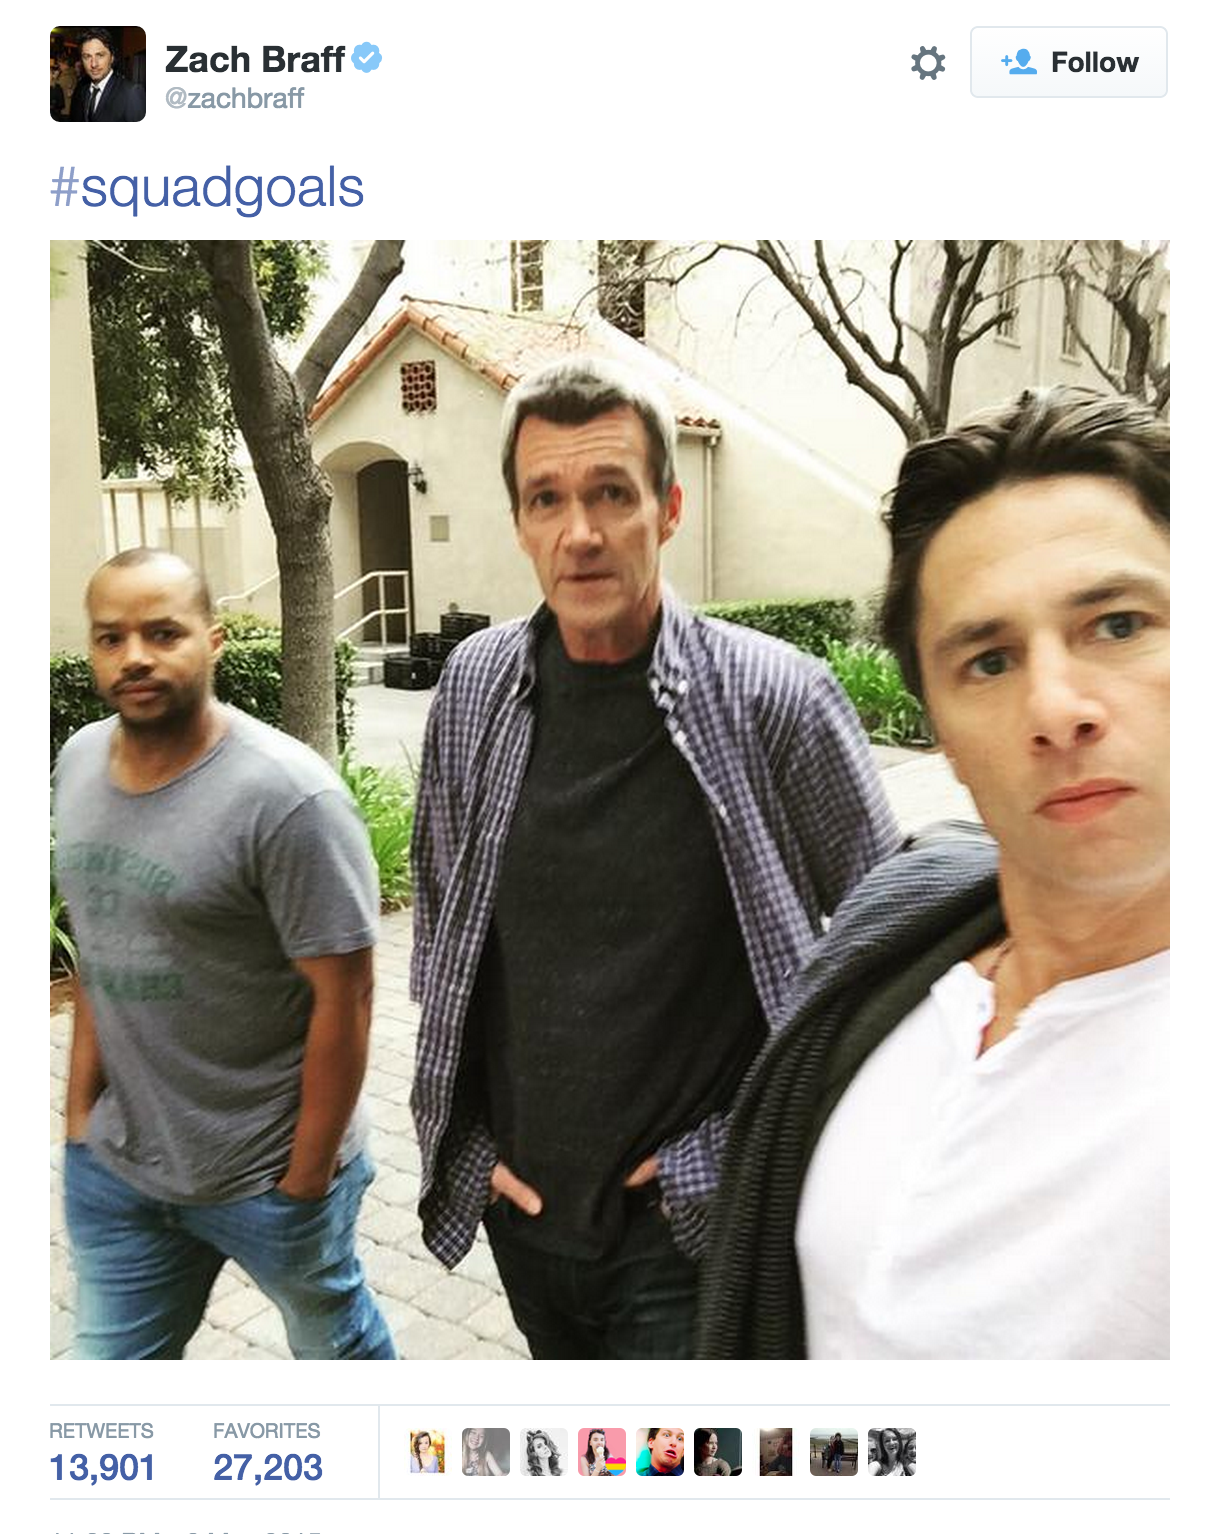
What if we look at the squad goals that were the most popular on an individual basis? Then our key squad is:
#teamturk, Scrubs 4 Ever. Etc.
This method of sorting reveals another problem, this particular Braff tweet was listed 17 times in the data, just as Braff. That suggests that there are other problems, and the lack of status text drops this powerful image behind the text rich posts related to One Direction.
By this ranking method, our squads are:
Srubs, Starwars(Vader), Napoleon Dynamite, Guardians of the Galaxy, Blue Mountain State (a television program on Spike TV, the network for men), Taylor Swift, some sort of poorly edited image, Eid, and then One Direction.
What did we learn?
Mapping the squads is difficult. Automated means allowed us to see past Braff’s raw numerical superiority. In a world where there a third of the dataset could have possibly been tied to Braff’s tweet, it seems possible, if not likely that large swaths of the data could have been lost in the process of building this model. I believe that the problem here is not with our approach or tools, but with Twitter itself. It was not our software, but the API that was exhausted. Perhaps this is the truth of the squad, it exists on the level of the aspiration and the imagination, not on the level of the database.
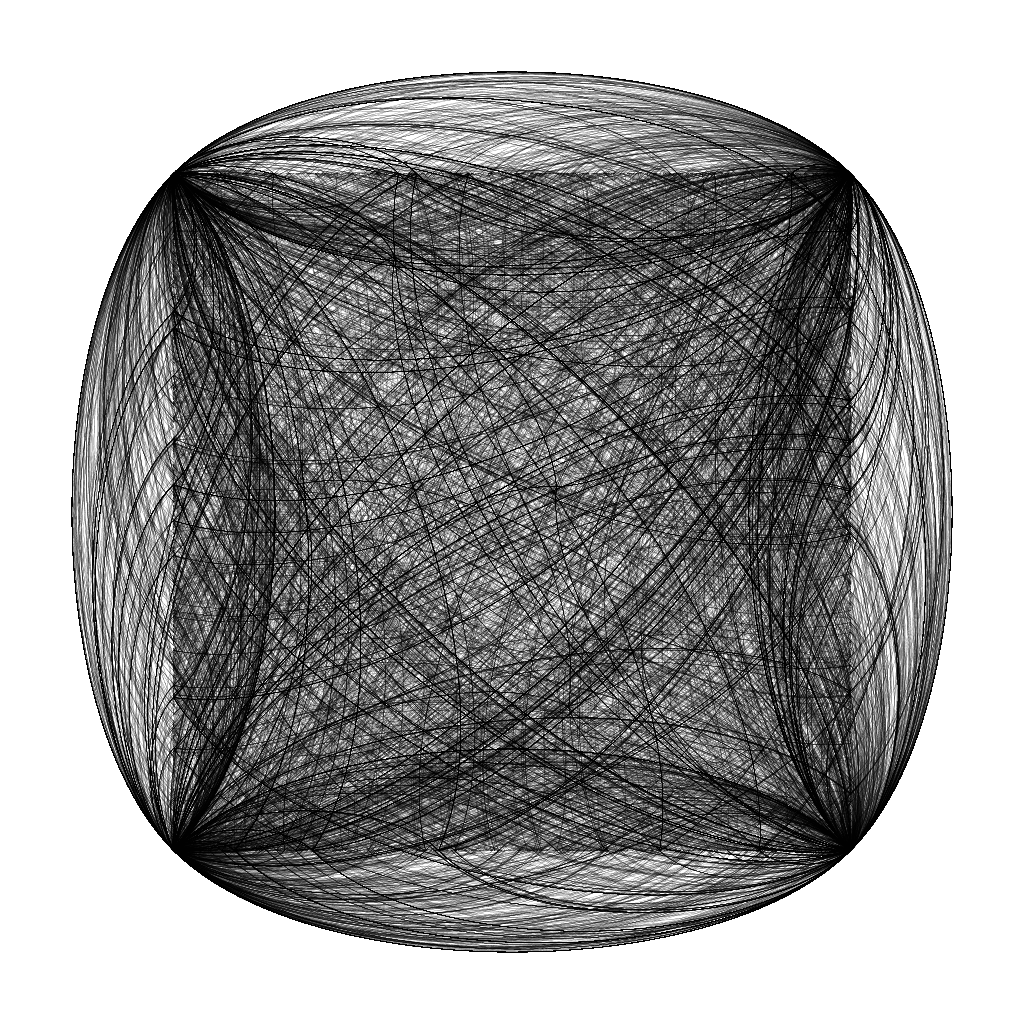
I have been actively tracking election activity on Twitter for two weeks now. The impact of strategic communication on Twitter is very clear. There are sockpuppets and shills everywhere. They eclipse organic use of the network. Here is a chart:
Well, I guess this is what you see when hundreds of users retweet the same content basically simultaneously and the entire network seems designed around communicating one perspective. That chart is garbage. Inferences made based on that chart are highly suspect.
It’s cleaning time.
Some of the first users I removed were clearly sockpuppets. One user sends dozens of posts per hour including pictures from Victoria’s Secret, Bob Marley, popular image macros (such as keep calm memes), and retweets of popular figures like Joel Osteen, along with some libertarian content. This seems like it could be the work of a robot as it maps what would be popular content.
Sorting out what it means for such a large percentage of links to include rich media is also difficult. Could half of people want to share an image with every conversational tweet, or is this just another indicator that this is an artifact of autotelic speech?
Here is a cleaner chart:
Suddenly Scott Walker is everywhere because of an extreme position on immigration, Trump is in the pack, and the polls don’t seem to matter. The top two clusters are still a bot retweeted tweet and a counter effort to that tweet. This is not an organic conversation network.
In short, Twitter is not a poll. Twitter is a microbroadcasting network utilized by a variety of groups to create the illusion that they enjoy broad popular support. Although this will not curtail research on Twitter, or the coverage of Twitter by the legacy media, it is important to remember that it isn’t a transparent window in the social now, but a contested rhetorical field.
The alternative to the consideration of Twitter as a rhetorical struggle is to suppose that a spammer retweeting pictures from Victoria’s Secret and cool pictures of guitars is an expression of genuine politics.
To this point in the election, the biggest surprise has been the insurgent candidacy of reality television star Donald Trump. The strength of his candidate has clearly hinged on two things: his ability to project his views independent of the legacy media (his reach is astounding via Twitter) and his positioning as an insurgent right wing candidate against the orthodoxy of party media and discipline. For all the attachment to party structures and the historical right, there is a spirit of rebellion to various Tea Party groups. The main hashtags organizing Trump’s online presence have been #Trump2016 and #makeamericagreatagain. As a part of this project, I have been tracking the basic Trump hashtag for sometime.
One aspect of Trump analysis could take the form of network mapping, this approach would either create a pseudo-network of users to terms, or my favorite approach to map the @ network of a large slice as a conversation network. Another approach is to use computer topic modeling to read all of the Tweets. This post will do that, using Mallet deployed through R. This is a rough topic model of all #Trump2016 material so far.
I will write a more complete methodological entry about my approach here later. Right now, I have some processing power and software issues, my University will resolve these soon. Also, building libraries of stopwords is tricky, as little phatic and coordinating moments are of great interest for critical/cultural research, which generally hasn’t been the core audience for topic modeling systems.
The Data
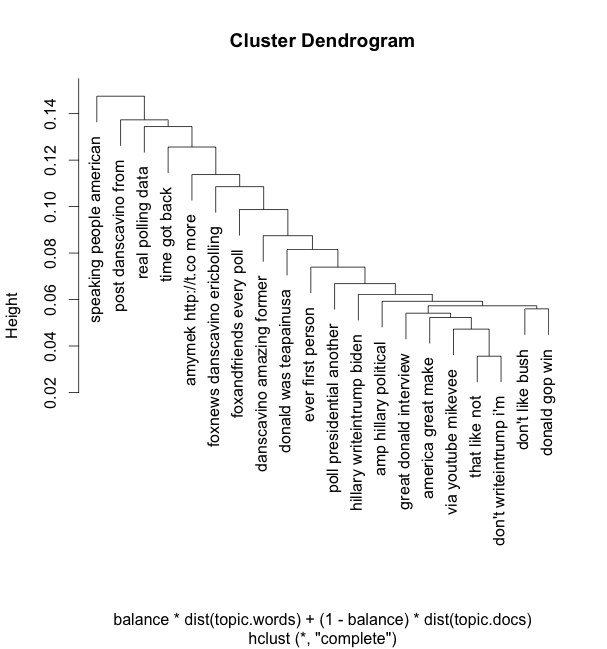
At first these topic lines may seem silly, but they do represent connections between terms across the tweets recognized by the topic modeler. This dendrogram shows how topics are merged together to represent the entire Trump dataset.
As you can see Clinton and Biden make in the topic labels, as does a one Republican, in the appropriately named label: don’t like bush.
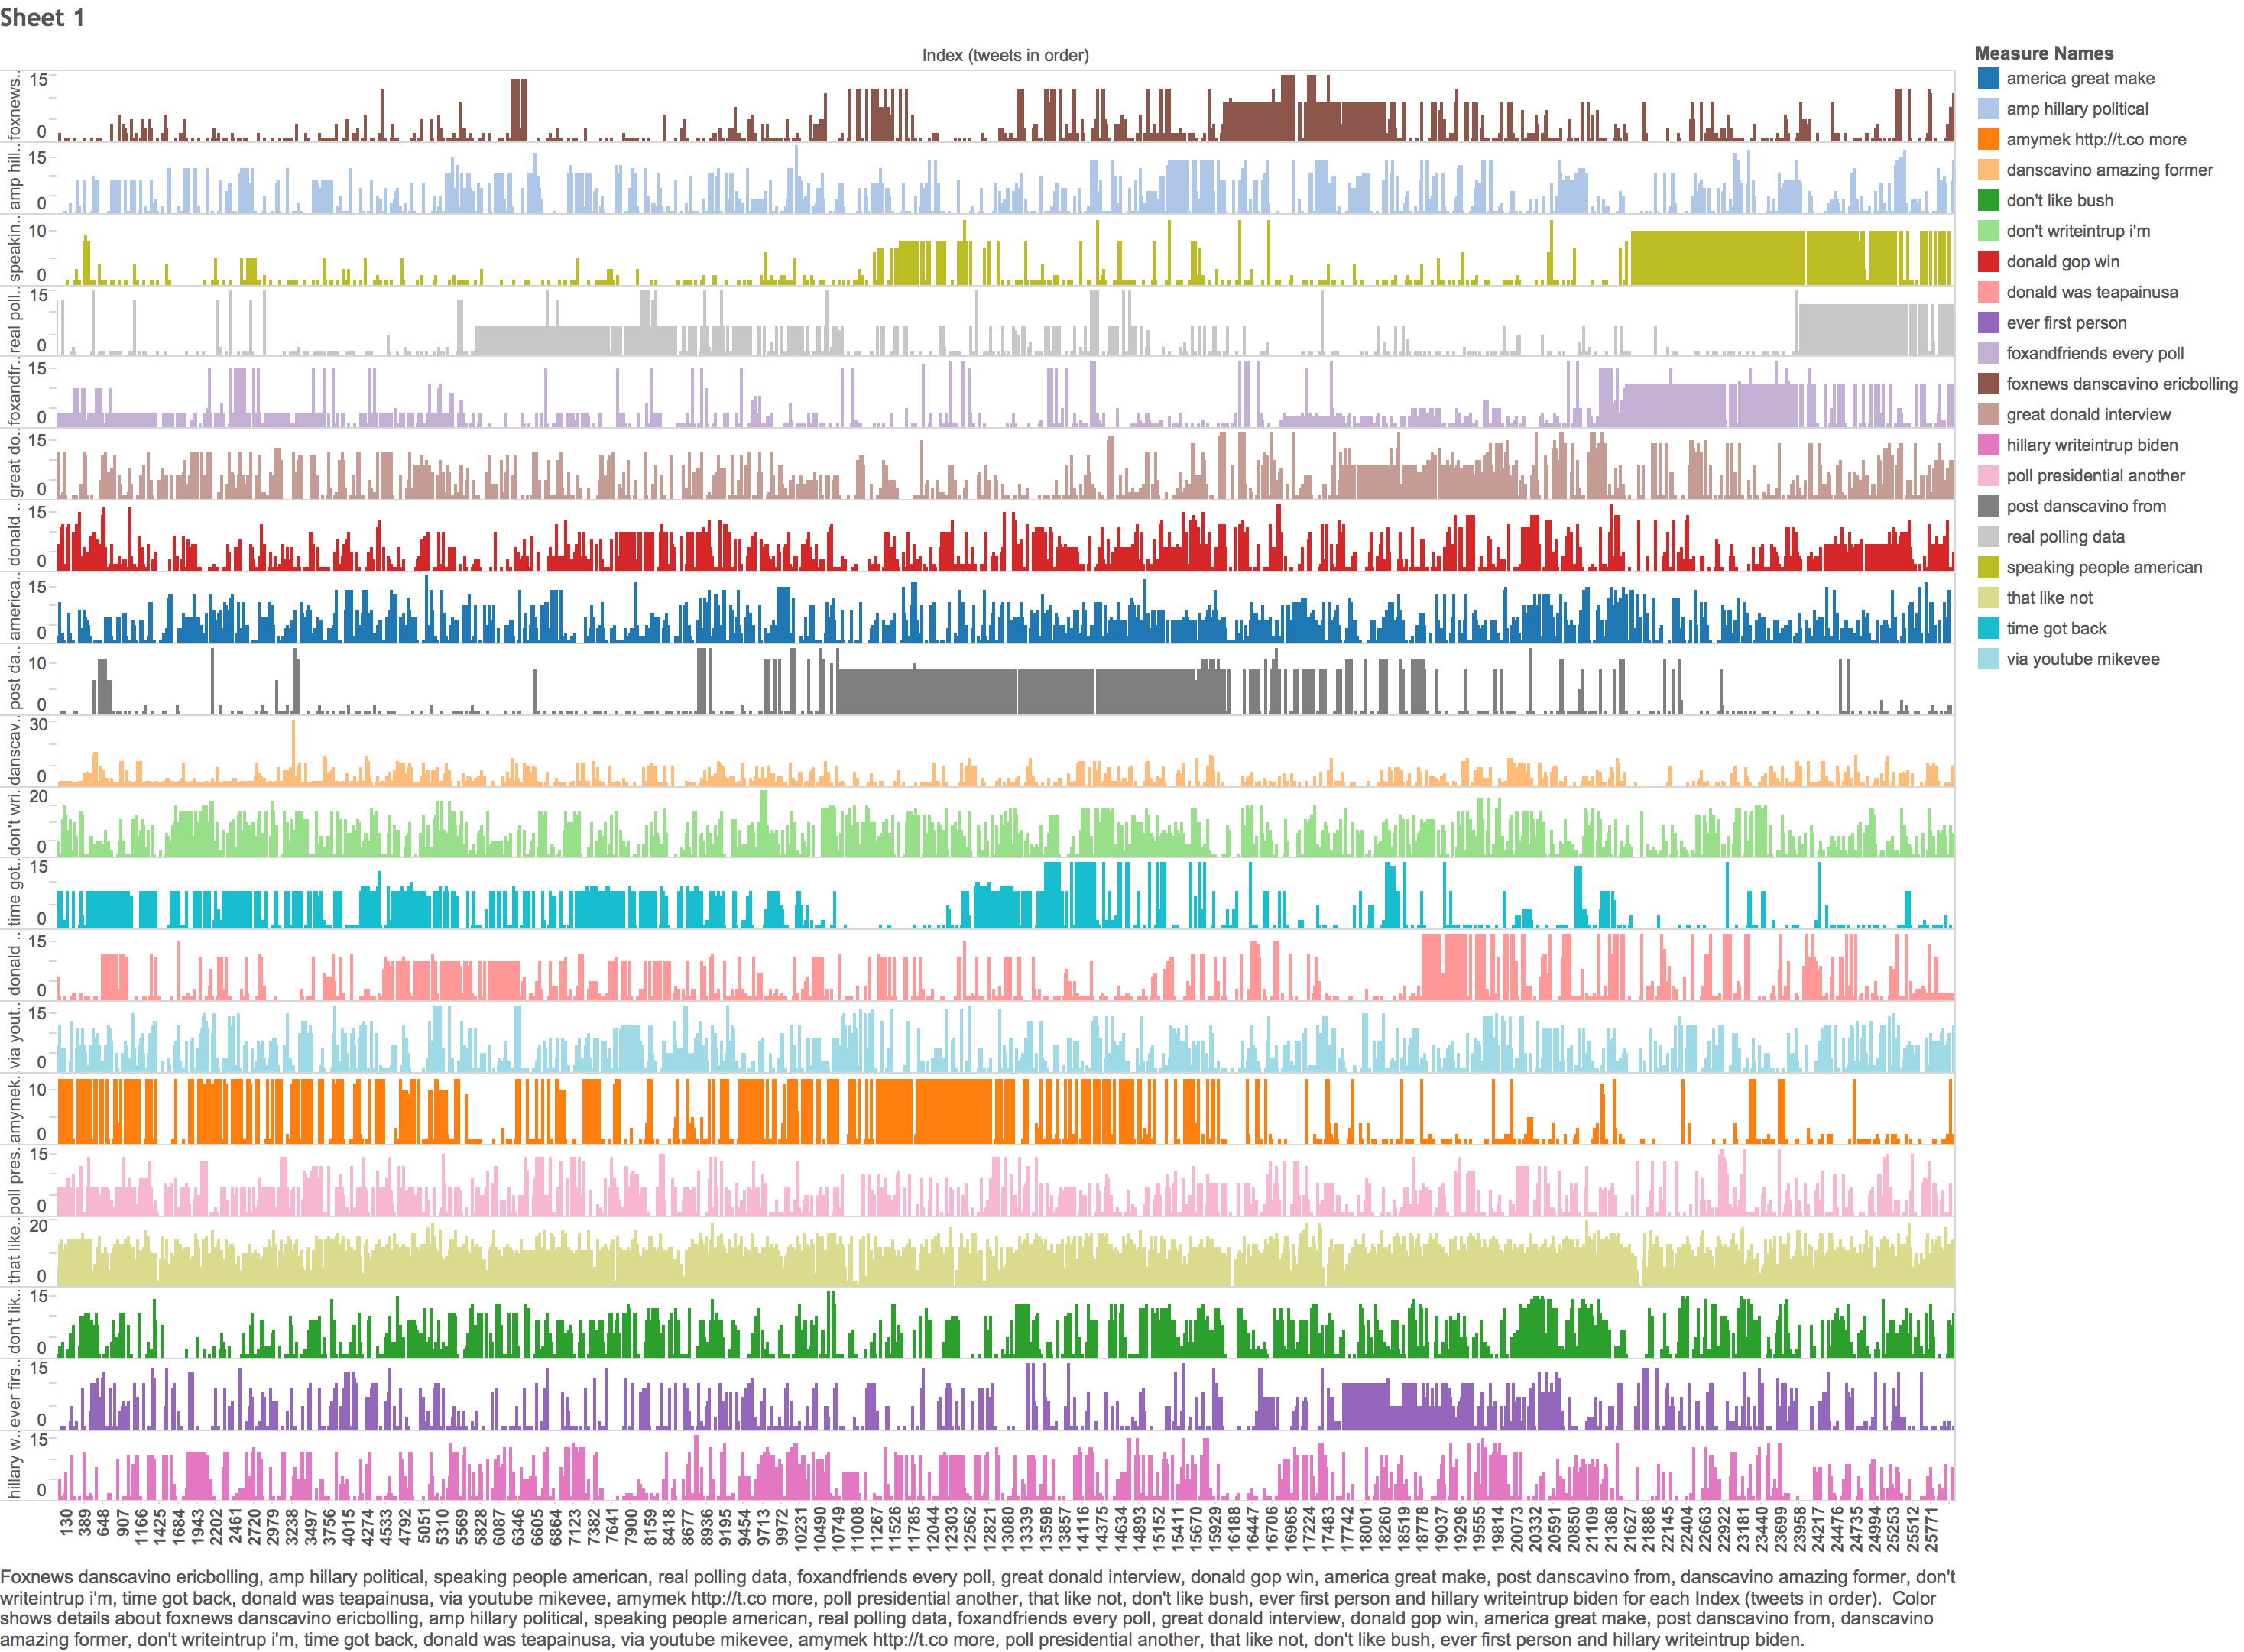
This is the analysis of the flow of those patterns so far. notice the large gray blob in the center – this is a field of activity basically run by danscavino, a former Trump advisor. During the time around the debate he basically was the Twitter conversation. The olive green topic appears later and is now important, the message of these tweets: the American people are speaking. Much of this blocking comes from retweet storms where users retweet or redeploy an image macro or link. The impact of Twitter shortened URLs in particular has fallen off, this is the popsicle orange color in the lower half of the chart.
An analysis of the data as a network might give some additional information about diffusion and network structure, given the inclusion of television programs and personalities in the list of topic labels it seems possible, if not likely that this approach to topic modeling has also identified key figures in the discourse network.
If other research about the dimensions of the cultural position of conservative populism is any guide, the deployment of the “people speaking” in the Twitter stream suggests that the rhetorical frames of the Tea Party have fused with the Trump campaign. The hostility of these frames for the traditional steering media of the conservative public sphere combined with the demand for real data/polls suggests that the underlying argument that Trump trumps pundits may have real resonance. Over in the “who is winning” tab a similar analysis suggests that Trump on immigration is a central category, and that Sanders and Clinton are more likely to appear as mineable topics than other candidates.
Does this mean that Trump could win the nomination? Unknown. Could it be that we should take a step back and honestly measure if we think that Twitter is a proxy for real public affect? Yeah, that would be really important. Furthermore, this approach does not attempt sentiment analysis, so it is possible that many of these tweets may actually be negative for Trump. This mismatch between intensity and valence was a major issue for the Romney campaign in 2012, remember, they were winning Twitter after all. Or at least, that is what they said.
An empirical approach to social media and election research.